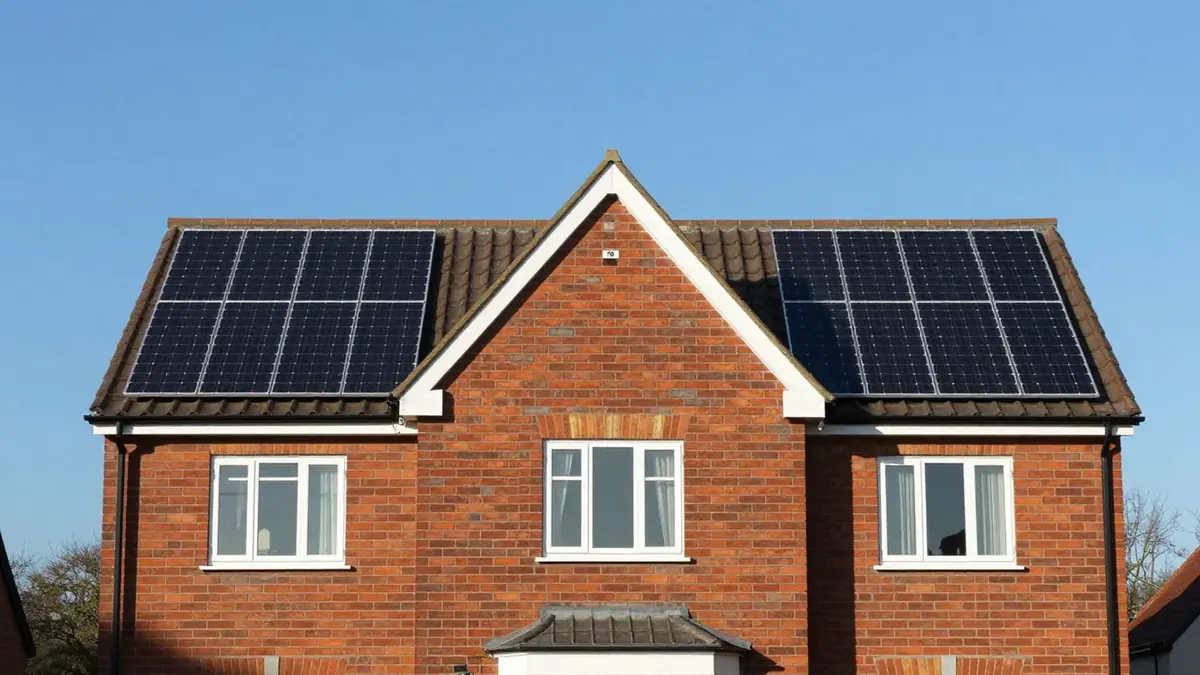
East or west facing solar panels in the UK make roughly 15% to 20% less over a year than south facing ones. PVGIS modelling for three cities shows a similar gap of about 17% to 23% at a 30 to 35 degree tilt. A lower total does not rule them out, because many roofs have no better option.
What the sources say
Energy Saving Trust says east or west facing systems tend to get around 15% to 20% less energy than south facing ones. That is the simplest single rule to remember. It also fits our calculator, which applies a factor of 0.86 for an east or west roof.
The calculator is a quick estimate. However, we checked it against a second source. PVGIS v5.3, the European Commission’s modelling tool, lets us compare orientations directly. We assumed crystalline silicon panels and a 14% system loss in each case.
PVGIS figures for three cities
The table shows annual kWh per kWp at a 35 degree tilt, then the loss against a south facing roof.
| City | South | East | West |
|---|---|---|---|
| London | 1,019 | 817 (19.8% less) | 787 (22.8% less) |
| Manchester | 886 | 717 (19.1% less) | 702 (20.8% less) |
| Glasgow | 853 | 673 (21.1% less) | 683 (19.9% less) |
At a shallower 15 degree tilt the gap narrows to about 11% to 13%. In London, for example, the east figure is 843 against 951 for south. A low-pitched roof therefore costs you less when it faces east or west.
PVGIS gives a slightly bigger loss than the Energy Saving Trust range at a 35 degree tilt. That is fine, since each source uses its own method. Use the range, not a single number, when you plan.
What that means in kWh
Consider a 4kWp system, for example. In London, south facing panels make about 4,076 kWh a year. East facing ones make about 3,268 kWh and west facing ones about 3,148 kWh. The difference is around 800 to 930 kWh.
A split array, with half the panels on each side, lands in between. Similarly, the loss sits near the middle of the two figures. In London the average of the two is about 802 kWh per kWp, or about 3,208 kWh from 4kWp. Manchester works out at about 2,838 kWh against 3,544 kWh for south.
Meanwhile, for cities where we hold only south figures, you can apply the Energy Saving Trust range. A 4kWp south facing system makes about 3,788 kWh in Sheffield. An east or west roof there gives roughly 3,030 to 3,220 kWh. Our pages on solar output in Sheffield, solar output in Liverpool and solar output in Oxford show each city’s south facing baseline.
Why many homes still choose east-west
Many terraced and semi-detached roofs face east and west, with no south slope. For those homes the real choice is east-west panels or none. A split array also spreads output across the day. The east side peaks in the morning and the west side in the afternoon.
That shape can suit some households. Suppose you are out at midday but home early and late. A split array may then match your use better than a south roof. However, the total is still lower, so the saving depends on your own pattern.
Roof direction also changes what each kWh is worth to you. A kWh used at home currently saves about 26.32p, according to the Ofgem price cap for October to December 2026. An exported kWh typically earns around 12p, according to Energy Saving Trust.
Our post on the Smart Export Guarantee explains how that payment works. Using more of your own output therefore matters, and a flatter daily curve can help. It will not close the whole gap.
It does narrow the gap in money terms for some homes. A self-used kWh is worth more than twice an exported one.
Making up the loss
Still, you can add panels to make up for a weaker direction, if the roof has space. Losing 15% to 20% means you need about 18% to 25% more capacity to match a south roof. On the DESNZ median cost of £1,595 per kW, each extra kWp adds roughly that amount before any discount.
Shade can undo the gain, because the low morning and evening sun is easy to block. Our guide to solar panel shading and optimisers explains how installers handle it. Cleaning is another small factor, and we cover it in an upcoming post on whether cleaning solar panels increases output.
Checking a quote for an east-west roof
Ask the installer to show the MCS estimate for each roof face, not one blended number. Under MCS standard MIS 3002, they use the kWh per kWp value for your postcode, pitch and orientation. They also apply a shade factor.
Then compare their figures with ours, since a large mismatch is worth questioning. Our guide to what kWh per kWp means shows how to read the numbers. Our post on how to check a solar quote lists the questions to ask.
If an estimate looks high for an east-west roof, ask for the workings. A fair installer will show the kWh per kWp value, the shade factor and the system size behind the number. Our overview of solar panel installation explains what a survey should cover.
Next steps
Open the solar yield calculator, choose “East or west”, and compare it with “South-ish” for your region. That shows the gap for your own roof. When you want real figures, you can request quotes and we will pass your enquiry to MCS-certified installers.