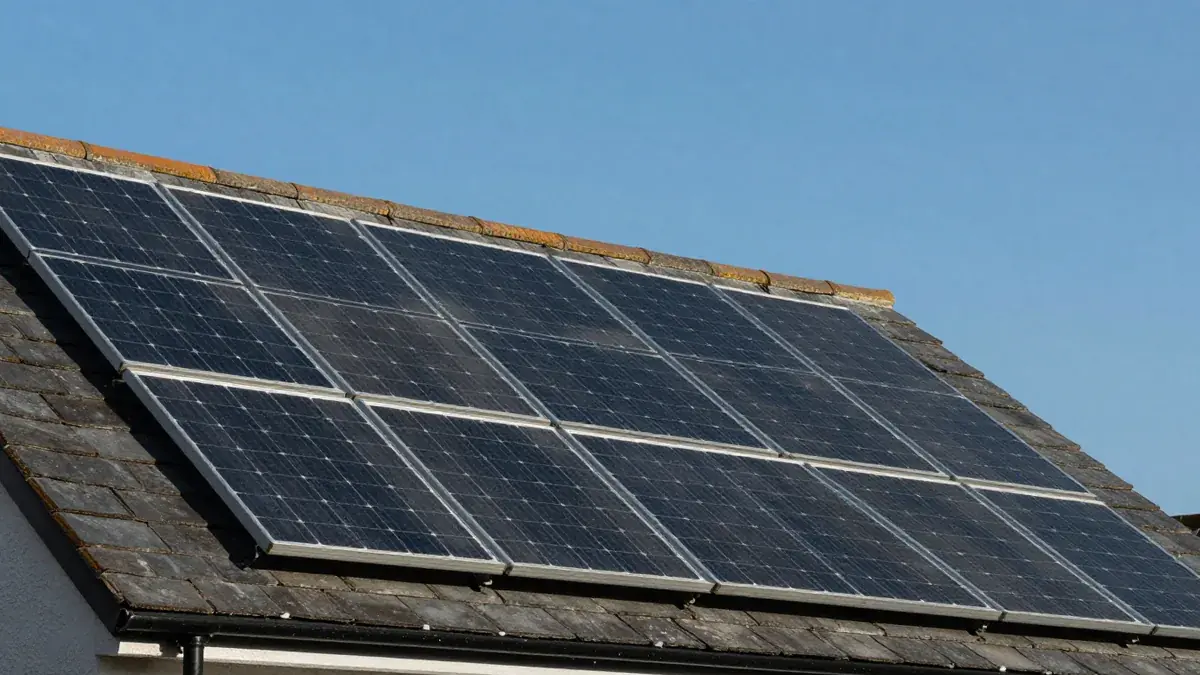
kWh per kWp is the number of units of electricity a solar system makes in a year for each kilowatt of panels. In the UK, a south-facing roof gives roughly 850 to 1,160 kWh per kWp depending on where you live. Multiply it by your system size and you have a first estimate.
What the two units mean
A kWp, or kilowatt-peak, is the rated size of the panels under test conditions. A system of 4 kWp has panels that add up to 4 kW at their best. However, it is a size label, not a promise of what you will produce.
A kWh is the energy you actually get. It is what your meter counts and what your supplier bills you for. Dividing yearly kWh by system size in kWp gives you kWh per kWp.
That makes it a fair way to compare systems of different sizes. A 3 kWp roof and a 6 kWp roof sit on the same scale. Because the figure ignores panel count, it depends on place, roof direction, tilt and shade.
How installers use it
The MCS standard MIS 3002 sets the method. Start with the installed kWp. Multiply by the kWh per kWp value for your postcode zone, roof pitch and direction, then by a shade factor. A clear horizon scores 1.00.
The same standard says the estimate is guidance for the first year only. It is not a guarantee of performance. Therefore you should get it in writing before you accept a quote.
That formula is also the backbone of the Solar Yield calculator for UK solar yield. It starts from a regional figure, then applies roof direction and shade factors you can see and change.
What PVGIS says for UK cities
The European Commission’s PVGIS tool models output from satellite data. These figures use a south-facing roof at a 35 degree tilt and a 14% system loss. They show how far location alone moves the number.
| City | kWh per kWp a year | 4 kWp system |
|---|---|---|
| Brighton | 1,156 | about 4,624 kWh |
| Bristol | 1,023 | about 4,092 kWh |
| Leicester | 981 | about 3,924 kWh |
| Nottingham | 970 | about 3,880 kWh |
| Aberdeen | 893 | about 3,572 kWh |
| Glasgow | 853 | about 3,412 kWh |
Brighton makes about 36% more per kWp than Glasgow. Remember that gap when you compare a quote with a friend’s system elsewhere. Their figure may be right for them and wrong for you.
Two cities in the middle
The East Midlands sits near the middle of the range. PVGIS gives solar output in Nottingham as 970 kWh per kWp. For solar panels in Leicester it gives 981.
These sit only 11 kWh per kWp apart. On a 4 kWp roof that is 44 kWh a year, which is far less than a bit of shade can cost. As a result, your own roof direction and shade matter more than the town you live in.
Glasgow shows the other end. PVGIS gives solar panels in Glasgow 853 kWh per kWp, about 12% under Nottingham. Summer is still strong there, with 110 kWh per kWp in June, while December gives only 19.4.
Why the same city gives different numbers
Roof direction and tilt move the figure more than most people expect. PVGIS runs for London show 1,019 kWh per kWp at a 35 degree tilt facing south. Facing east it drops to 817, facing west to 787 and facing north to 541.
Tilt matters too. London at a 15 degree tilt gives 951, against 1,019 at 35 degrees. Pitches of 30 to 45 degrees work well, as the best tilt angle for solar panels in the UK post explains.
Energy Saving Trust puts east or west facing roofs at around 15% to 20% less than due south. That fits the London run, where east gives 20% less than south. Shade then comes on top of both.
How to use the figure on a quote
First, find the kWh per kWp behind the installer’s estimate. Divide the stated yearly kWh by the system size in kWp. Then compare the result with the PVGIS figure for your city, on the solar panel installation pages.
If the quote is much higher than PVGIS for a similar roof, ask why. Everything that follows, such as payback, depends on that number. For instance, the guide to solar panel payback shows how a higher yield flatters the return.
Next, check the export side. Output you do not use goes to the grid, and what you earn depends on the tariff. The Smart Export Guarantee guide covers how those payments work.
Finally, look at the panels over time. Output falls slowly each year, so the first-year figure is the best you will see. The guide to solar panel degradation puts a number on that.
Checking it once the system is live
Once your system runs, your inverter records every kWh. Divide your real yearly total by the kWp and compare it with the estimate. Since one year can be sunnier or duller than average, give it time.
An upcoming post on reading your solar inverter app explains the screens and what to look for.
Try it with your own roof
The yield calculator lets you set a region, roof direction, size and shade. It turns the kWh per kWp idea into a figure for your home. Although it is only an estimate, it gives you a starting point.
When you want a site-specific number, get quotes from MCS-certified installers. Solar Yield passes your enquiry on and does not install anything. Compare each firm’s kWh per kWp with the figures above before you decide.