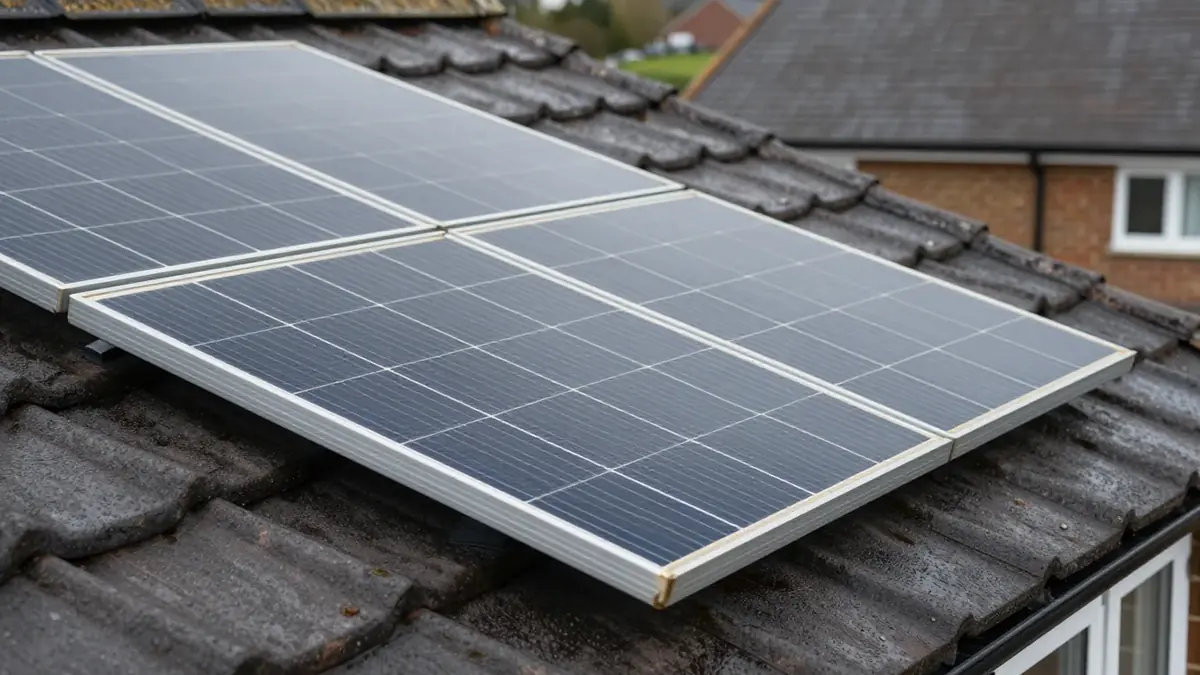
Solar panels lose a little output every year. A large review of measured systems found a median loss of 0.5% a year. A panel therefore keeps roughly 88% of its output after 25 years. That is slow, but you should still build it into any payback sum.
What the research says
The most cited figure comes from the US National Renewable Energy Laboratory. Its review of nearly 2,000 measured degradation rates found a median of 0.5% output loss per year. It appeared in 2012 and drew on modules of many ages and types.
That median hides a spread. Older modules often lost output faster than that. Newer ones tend to do better, although the review cannot say so for panels that did not yet exist.
Because the data is a median, some panels will beat it and some will fall short. Treat 0.5% a year as a sensible planning figure, not a guarantee for your roof. Your quoted panel’s datasheet gives the better guide.
What 0.5% a year does to a UK system
The loss compounds a little each year. After 25 years at 0.5% a year, a panel keeps about 88% of its first-year output. In other words, the total loss over that period is roughly 12%.
Take a 4 kWp system and the PVGIS figure for a south-facing roof at 35 degrees. In Brighton, with 1,156 kWh per kWp, year one gives about 4,624 kWh. By year 25 that falls to about 4,070 kWh.
Location sets the starting point, and degradation then trims it. The figures below use the same 88% factor. For the wider picture, see the solar panel installation service page.
| City | Year one | Year 25 |
|---|---|---|
| Brighton | about 4,624 kWh | about 4,070 kWh |
| Southampton | about 4,256 kWh | about 3,745 kWh |
| Aberdeen | about 3,572 kWh | about 3,143 kWh |
Three cities, one pattern
The pattern holds along the south coast. PVGIS gives solar output in Southampton 1,064 kWh per kWp. The same system loses roughly 510 kWh a year by the end of the period.
Brighton starts higher, so it loses more in kWh yet keeps the same share. The guide to solar panels in Brighton uses the same method. Aberdeen starts lower at 893 kWh per kWp, and an estimate for solar installation in Aberdeen should show the same slow slope.
The share lost is identical in all three. Only the base changes. That is why the location matters more for total output than degradation does.
What the warranty promises
Manufacturers typically give a 25-year performance warranty. It promises roughly 80% to 90% of original output at year 25, with 84% to 88% often quoted. These figures come from comparison sites and installer marketplaces, such as Heatable’s warranty guide, not from datasheets. Read the datasheet before you rely on them.
A performance warranty is not the same as a product warranty. The first covers output. The second covers defects in the panel and often runs for fewer years. Ask your installer for both in writing and check who pays for removal and replacement.
Warranties also depend on the maker surviving. A promise from a company that closes is hard to claim. The MCS certification of your installer and the guide to checking a solar quote help you ask the right questions.
The inverter is the weaker link
Panels have no moving parts, so they age slowly. The inverter works harder. Energy Saving Trust says an inverter needs replacing after around 12 years, while panels should last 25 years or more.
Inverter warranties usually run to five years at minimum. Many buyers extend them up to 15 years. Check what your quote includes, since a replacement mid-life is a real cost to plan for.
Bear this in mind if you add a battery, too. It sits on the same system and has its own lifespan. The post on whether a solar battery is worth it sets out the sums.
Why degradation matters for payback
Most quick payback sums use year-one output for every year. That overstates the return slightly. A 0.5% yearly loss lowers the lifetime total by around 6% against a flat figure. The average year sits near 94% of year one.
DESNZ puts the median installed cost near £1,595 per kW for systems up to 4 kW. A 4 kWp system therefore comes to about £6,400. A loss of 6% over the lifetime is small against that. It is still worth asking whether a quote’s saving figures include it.
Export income falls with output too. The Smart Export Guarantee guide explains how those payments work, and your exported kWh drop in step with generation. For the opening figure, the post on how much electricity a 4kW solar system generates is the place to start.
Keeping losses small
You cannot stop degradation, but you can avoid adding to it. Keep trees trimmed and check the inverter display now and then, as Energy Saving Trust suggests. A sudden drop in output is rarely degradation. It usually points to a fault, shade or a tripped switch.
Scotland brings its own questions about winter light and snow. A coming guide to solar panels in Scotland looks at them in detail.
Next steps
Use the yield calculator to see your year-one estimate, then apply the 0.5% a year loss to it by hand. Treat the result as a range, not a promise.
To compare real quotes, request quotes through Solar Yield. It is an enquiry-referral service, not an installer, so it passes your details to MCS-certified firms. Ask each one for its panel datasheet and its performance warranty terms.