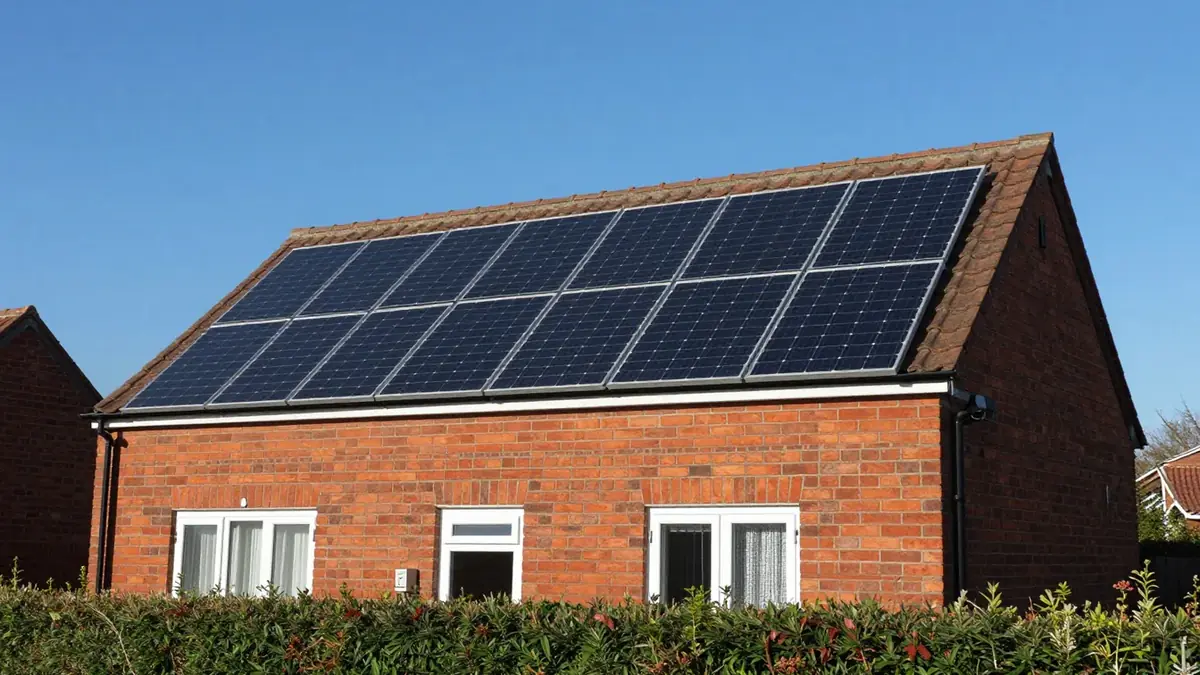
A 4kWp solar system on a south-facing UK roof makes roughly 3,400 to 4,600 kWh a year. The spread comes mostly from location, with Glasgow at the bottom and Brighton at the top. Shade, roof direction and weather then move your own figure up or down.
The short calculation
The sum is simple. Multiply the system size in kWp by the annual kWh that each kWp produces at your location. A 4kWp system in a place that gives 1,000 kWh per kWp makes about 4,000 kWh.
Installers work it out the same way. Under MCS standard MIS 3002, they multiply the installed kWp by a regional kWh per kWp value. They then apply a shade factor between 0 and 1. Our guide to what kWh per kWp means explains the unit in full.
What PVGIS says for three cities
We use data from PVGIS v5.3, the European Commission’s free modelling tool. The figures below assume crystalline silicon panels, a 14% system loss, a south-facing roof and a 35 degree tilt. Multiply each by four for a 4kWp system.
| City | kWh per kWp a year | 4kWp system a year |
|---|---|---|
| Plymouth | 1,122 | about 4,488 kWh |
| London | 1,019 | about 4,076 kWh |
| Birmingham | 968 | about 3,872 kWh |
Each city has its own page with a monthly breakdown. You can read about solar output in London, solar output in Birmingham and solar output in Plymouth. Plymouth gains about 10% on London and about 16% on Birmingham. Glasgow, by comparison, gives 853 kWh per kWp, or about 3,412 kWh from 4kWp.
Why the year is not flat
Output swings hard between seasons. In London, PVGIS gives 122.6 kWh per kWp in June and only 36.3 kWh in December. For a 4kWp system that is about 490 kWh in June against about 145 kWh in December.
As a result, a system that covers most of your daytime use in summer will barely dent your winter bill. Our post on solar panel output in winter goes through the dark months in more detail. The annual figure hides this, which is why a monthly view helps.
How it compares with what your home uses
Ofgem’s typical domestic consumption values put a medium household at 2,500 kWh of electricity a year on a standard meter. A 4kWp system in London makes about 4,076 kWh, which is more than that total. However, much of the output arrives at midday in summer, when many homes are empty.
The useful question is therefore how much you use while the sun is up. Someone working from home will use more of the output directly than someone out all day. Batteries and timers can shift some use, but they add cost.
What changes the number on your roof
Roof direction matters most after location. Energy Saving Trust says a system facing east or west tends to make 15% to 20% less than one facing south. We compare the two layouts in east-west solar panels and how much output you lose.
Shade is the other big factor, and it can cut output sharply. Tilt matters too, though less than most people expect. In London, PVGIS gives 1,010 kWh per kWp at 30 degrees and 1,019 at 35, a gap of under 1%.
Panels also lose a little output each year. A review of nearly 2,000 measured rates by NREL researchers found a median loss of 0.5% a year. Your first year is therefore close to the best year of the system’s life.
What 4kWp costs and what the output is worth
DESNZ data shows a median installed cost of £1,595 per kW for systems up to 4kW in 2025/26. That puts a 4kWp system at about £6,400, which includes installation and any VAT due. Energy Saving Trust uses a higher £7,600 for a typical 4.5kWp home system.
Each kWh is worth something different depending on what you do with it. Between October and December 2026, the Ofgem price cap sets the electricity unit rate at 26.32p per kWh. A kWh you use at home saves that amount, while one you export earns far less.
Energy Saving Trust says you typically get around 12p for each unit you export. For example, 1,000 kWh used at home saves about £263, but 1,000 kWh exported earns about £120. The scheme behind that payment is covered in the Smart Export Guarantee explained. A battery shifts the balance, and we weigh it in whether a solar battery is worth it.
Rates change often, so check them when you compare offers. The figures here are correct at the time of writing.
How to get a number you can rely on
Start with an honest estimate. Our solar yield calculator lets you set system size, region, roof direction and shade, then shows annual output. It runs in your browser and sends nothing anywhere.
Then check that estimate against real quotes. Every MCS installer must give you their own output estimate, and it should land close to yours. If it is much higher, ask how they reached it.
Sizing is the next question. Our upcoming guide on how many solar panels you need will help with that. For the wider process from survey to commissioning, see our overview of solar panel installation.
Next steps
Try the solar yield calculator first, using your own roof direction and shade. When the numbers look worthwhile, you can request quotes and we will pass your enquiry to MCS-certified installers. Solar Yield is not an installer, so compare every estimate you receive against your own.