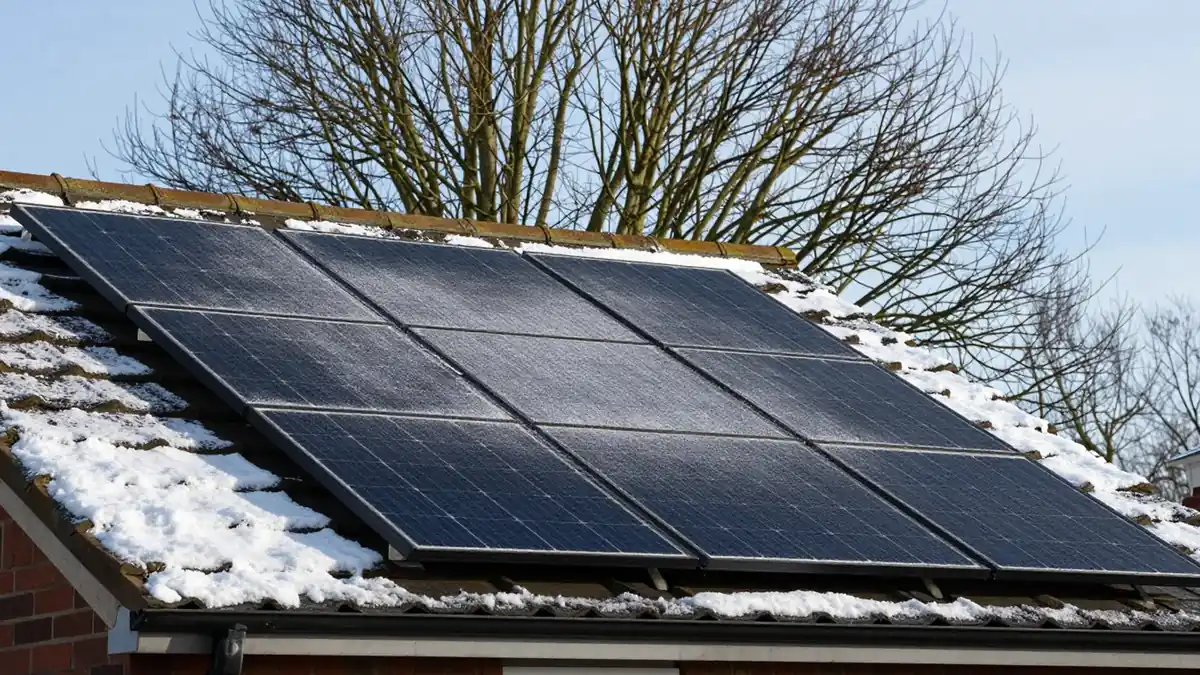
In December a 4kWp UK solar system makes roughly 110 to 140 kWh, about 3% of its annual total. The three winter months together bring around 11% to 13% of a year’s output in England. Winter still produces something, but it will not cover your heating or evening use.
What PVGIS shows for winter months
We use PVGIS v5.3, the European Commission’s modelling tool. The figures assume a south-facing roof at a 35 degree tilt and a 14% system loss. The table multiplies each city’s monthly kWh per kWp by four, for a 4kWp system.
| City | December | January | June |
|---|---|---|---|
| Manchester | about 113 kWh | about 108 kWh | about 443 kWh |
| Leeds | about 127 kWh | about 137 kWh | about 448 kWh |
| Norwich | about 140 kWh | about 155 kWh | about 495 kWh |
You can see each city’s full monthly table on its own page. Read about solar output in Manchester, solar output in Leeds and solar output in Norwich for the detail. In December Norwich makes about 24% more than Manchester. In June the gap shrinks to about 12%.
Why December is so weak
Daylight is short because the sun sits low. Even on a clear day, the light crosses more atmosphere and hits the panels at a shallow angle. Cloud then cuts what is left.
December in Manchester averages about 3.6 kWh a day from 4kWp, since 113 kWh spread over 31 days gives that. In June the same system averages nearly 15 kWh a day. Winter output is a fraction of summer output, and the annual total hides that swing.
Location makes it worse, since the north gets less light. PVGIS gives Glasgow only 19.4 kWh per kWp in December, against 36.3 in London. That puts a 4kWp system in Glasgow near 78 kWh for the month, or about half of London’s roughly 145 kWh.
What share of the year comes in winter
However, winter looks small against the whole year. Adding December, January and February for each city gives the share of the annual figure.
For Manchester, those three months bring about 11.3% of the year. Leeds and Norwich each reach about 12.2%, while Glasgow gets about 9.8%. Summer, by contrast, is the real engine. June to August brings roughly 315 to 360 kWh per kWp in the English cities we checked.
So a good annual number does not mean a good winter. A system that pays back well over twelve months can still leave you buying most of your winter power from the grid.
What affects winter output beyond the weather
Roof direction matters more when the sun is low. Energy Saving Trust says east- or west-facing systems tend to make 15% to 20% less than south-facing ones over a year. Our post on east-west solar panels shows what that trade-off looks like in practice.
Shade bites harder in winter because shadows grow long. A chimney or tree that barely touches the array in June can cover part of it in December. Our guide to solar panel shading and optimisers explains how installers deal with it.
Tilt also plays a part, because a steeper roof catches low sun better. PVGIS puts the annual optimum in these cities at 39 to 41 degrees. Our post on the best tilt angle for solar panels in the UK goes through the trade-offs.
Finally, panels age slowly. A review by NREL researchers found a median loss of 0.5% a year. As a result, winter output changes very little in the first decade.
Planning your money around the dark months
Winter shapes the saving more than the annual output suggests. Between October and December 2026 the Ofgem price cap sets the electricity unit rate at 26.32p per kWh. At the time of writing, each kWh you make and use is worth that much. However, you make far fewer in winter.
Most of your annual saving therefore lands between spring and early autumn. For a 4kWp system in Leeds, about 463 kWh arrives from December to February, against roughly 1,345 kWh from June to August. That is worth planning for if you are comparing payback figures.
A battery does not change the picture much in winter. It stores energy, it does not create it, and there is little surplus in December. Energy Saving Trust puts battery storage at around £5,000 to £8,000. We look at that cost in our battery service overview.
Setting realistic expectations
Therefore, treat the winter figures as a rough guide, not a promise. PVGIS models an average year, and a dull December can come in well under it. A bright one can beat it.
Installers must give you an MCS estimate before you sign, and MCS says it is guidance only for the first year. Ask to see the monthly split, not just the annual figure. Our upcoming post on north-facing solar panels covers roofs that face away from the sun. For the install side, our solar panel installation overview explains the steps.
Our post on solar panel degradation puts numbers on how output fades over time.
Next steps
Try the solar yield calculator with your own roof direction and shade to see an annual figure. Then use the monthly table on your nearest city page to see how it splits. When you are ready to compare offers, you can request quotes and we will pass your enquiry to MCS-certified installers.